Albany’s housing prices have increased substantially in the last five years. The median home sales price in January 2019 was $269,950, compared to $440,000 in January of 2022 – representing almost a 65 percent increase in the median sales price in 3 years. Three years ago, there were 116 active listings compared to 22 in January 2022.
Median
Sales Price
$440,000
13.7%
New
Listings
49
-7.5%
Active
Inventory
22
-24.1%
Median
Days on Market
10
-78.7%
Closed
Sales
36
-57.6%
Median
Sold $/sq.ft.
$248
-2.0%
Home Sales Data, Willamette Valley Multiple Listing Service, January 2022
2021 Albany Home Sales Summary
| Trend | Year-to-date, January through December | |||
|---|---|---|---|---|
| 2020 | 2021 | |||
Median Sales Price |
16.3% |
$326,745 |
$380,000 |
|
Closed Sales |
-0.7% |
998 | 991 | |
Median Days on Market |
-23.7% |
59 | 45 | |
List Price Received |
2.8% |
100.8% | 103.6% | |
Sold $/sq.ft. |
20.9% |
$196 | $237 | |
New Listings |
-8.5% |
1,097 | 1,004 | |
Willamette Valley Multiple Listing Service
Market Rate Rents
Albany is experiencing a very low rental vacancy rate. The following table is a result of rents found online in January of 2022.
| Studio | One-Bedroom | Two-Bedroom | Three-Bedroom | Four-Bedroom | |
|---|---|---|---|---|---|
| average | $1,215 | $1,165 | $1,165 | $1,854 | $1,995 |
| low | $ 800 | $ 650 | $ 999 | $1,290 | $1,995 |
| high | $1,380 | $1,465 | $1,640 | $2,845 | $2,850 |
January 2022
Rents have increased substantially in the last five years. Fair market rents have increased by 25 to 51% since 2017, with the biggest increases seen in studios and one-bedroom units. A household must earn $76,000 to afford $1,900 in rent, without factoring for utilities.
Fair Market Rents
Every year, the Department of Housing and Urban Development (HUD), annually estimates the “Fair Market Rents (FMRs)” for cities and zip codes based on the 40th percentile gross rents for standard quality units within the specified area. The fair market rents are used to determine payment standard amounts for the Housing Choice Voucher program, to determine initial rents for housing assistance payment programs and renewal rents for some expiring project-based Section 8 contracts.
Fair Market Rents by Unit Bedrooms, 97321
| Year | Efficiency | One-bedroom | Two-bedroom | Three-bedroom | Four-bedroom |
|---|---|---|---|---|---|
| 2022 | $840 | $930 | $1,140 | $1,600 | $1,900 |
| 2021 | $830 | $910 | $1,150 | $1,620 | $1,940 |
| 2020 | $770 | $880 | $1,120 | $1,600 | $1,890 |
| 2019 | $680 | $790 | $1,010 | $1,460 | $1,710 |
| 2018 | $610 | $710 | $920 | $1,340 | $1,560 |
Fair Market Rents by Unit Bedrooms, 97322
| Year | Efficiency | One-bedroom | Two-bedroom | Three-bedroom | Four-bedroom |
|---|---|---|---|---|---|
| 2022 | $820 | $870 | $1,150 | $1,600 | $1,880 |
| 2021 | $790 | $850 | $1,120 | $1,570 | $1,870 |
| 2020 | $720 | $830 | $1,090 | $1,550 | $1,810 |
| 2019 | $640 | $750 | $990 | $1,430 | $1,640 |
| 2018 | $580 | $690 | $910 | $1,330 | $1,510 |
HUD Data
Housing Choice Voucher Waiting List
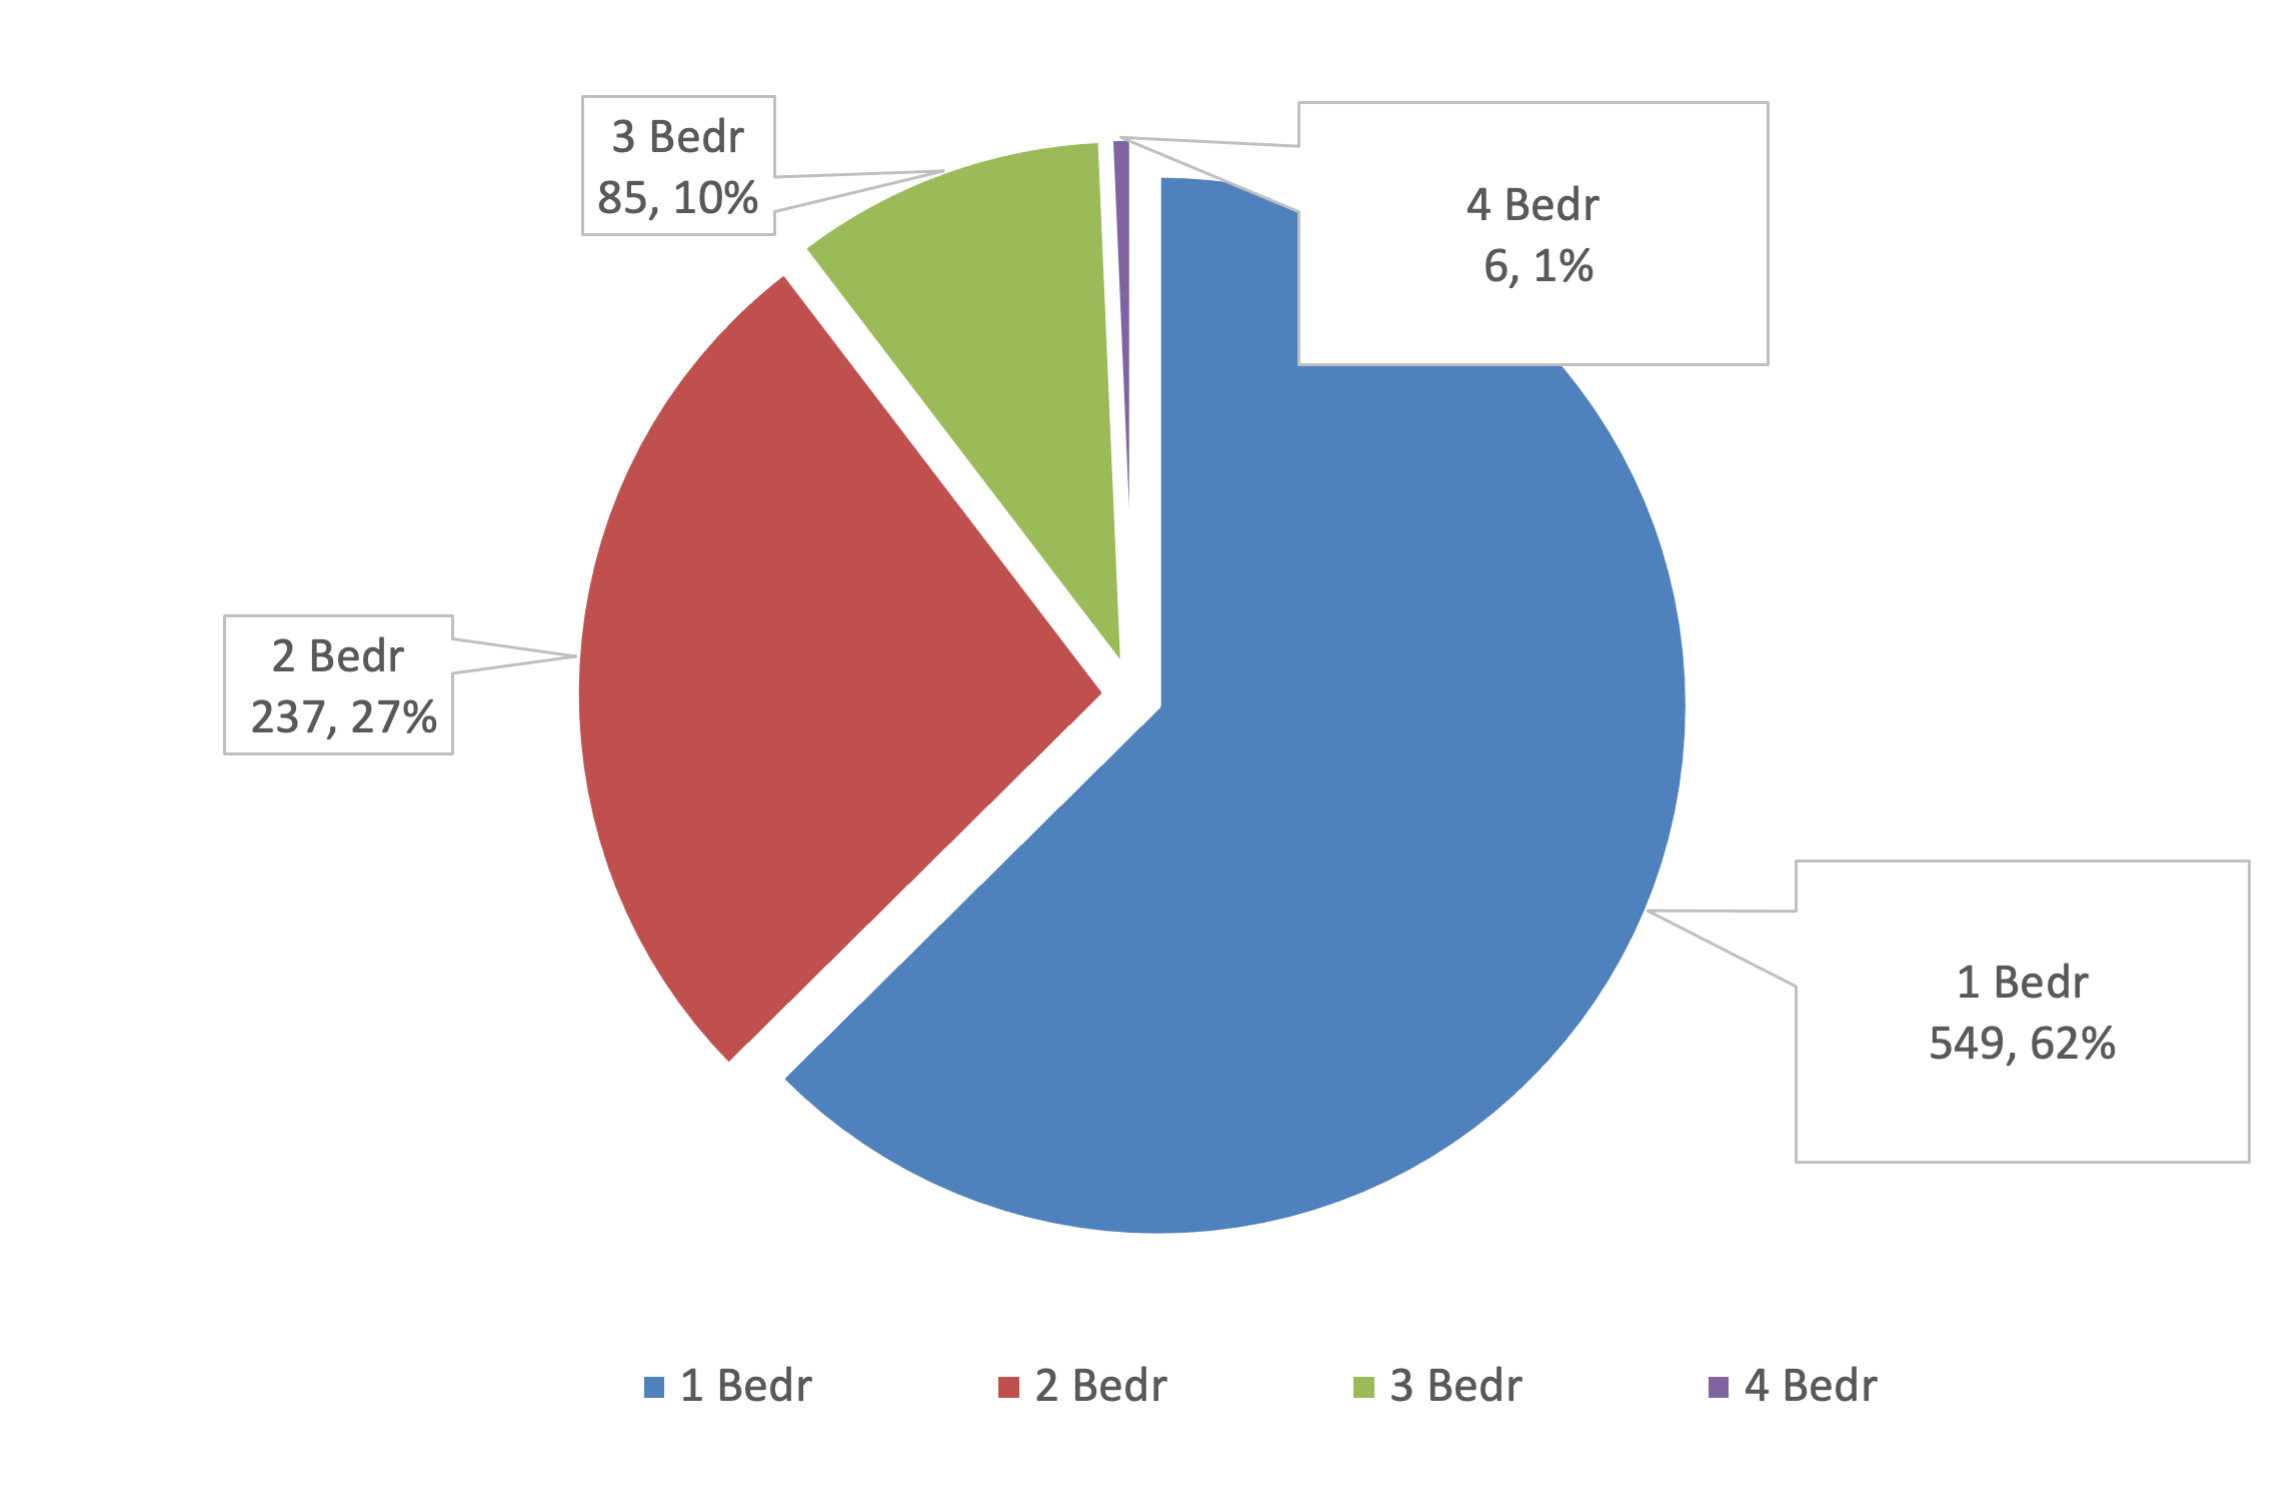
In December 2021, there were 877 Albany households were on the waiting list for Housing Choice Vouchers. More than half of these households (549) are waiting for one-bedroom units.
Waitlist Unit Types by Need
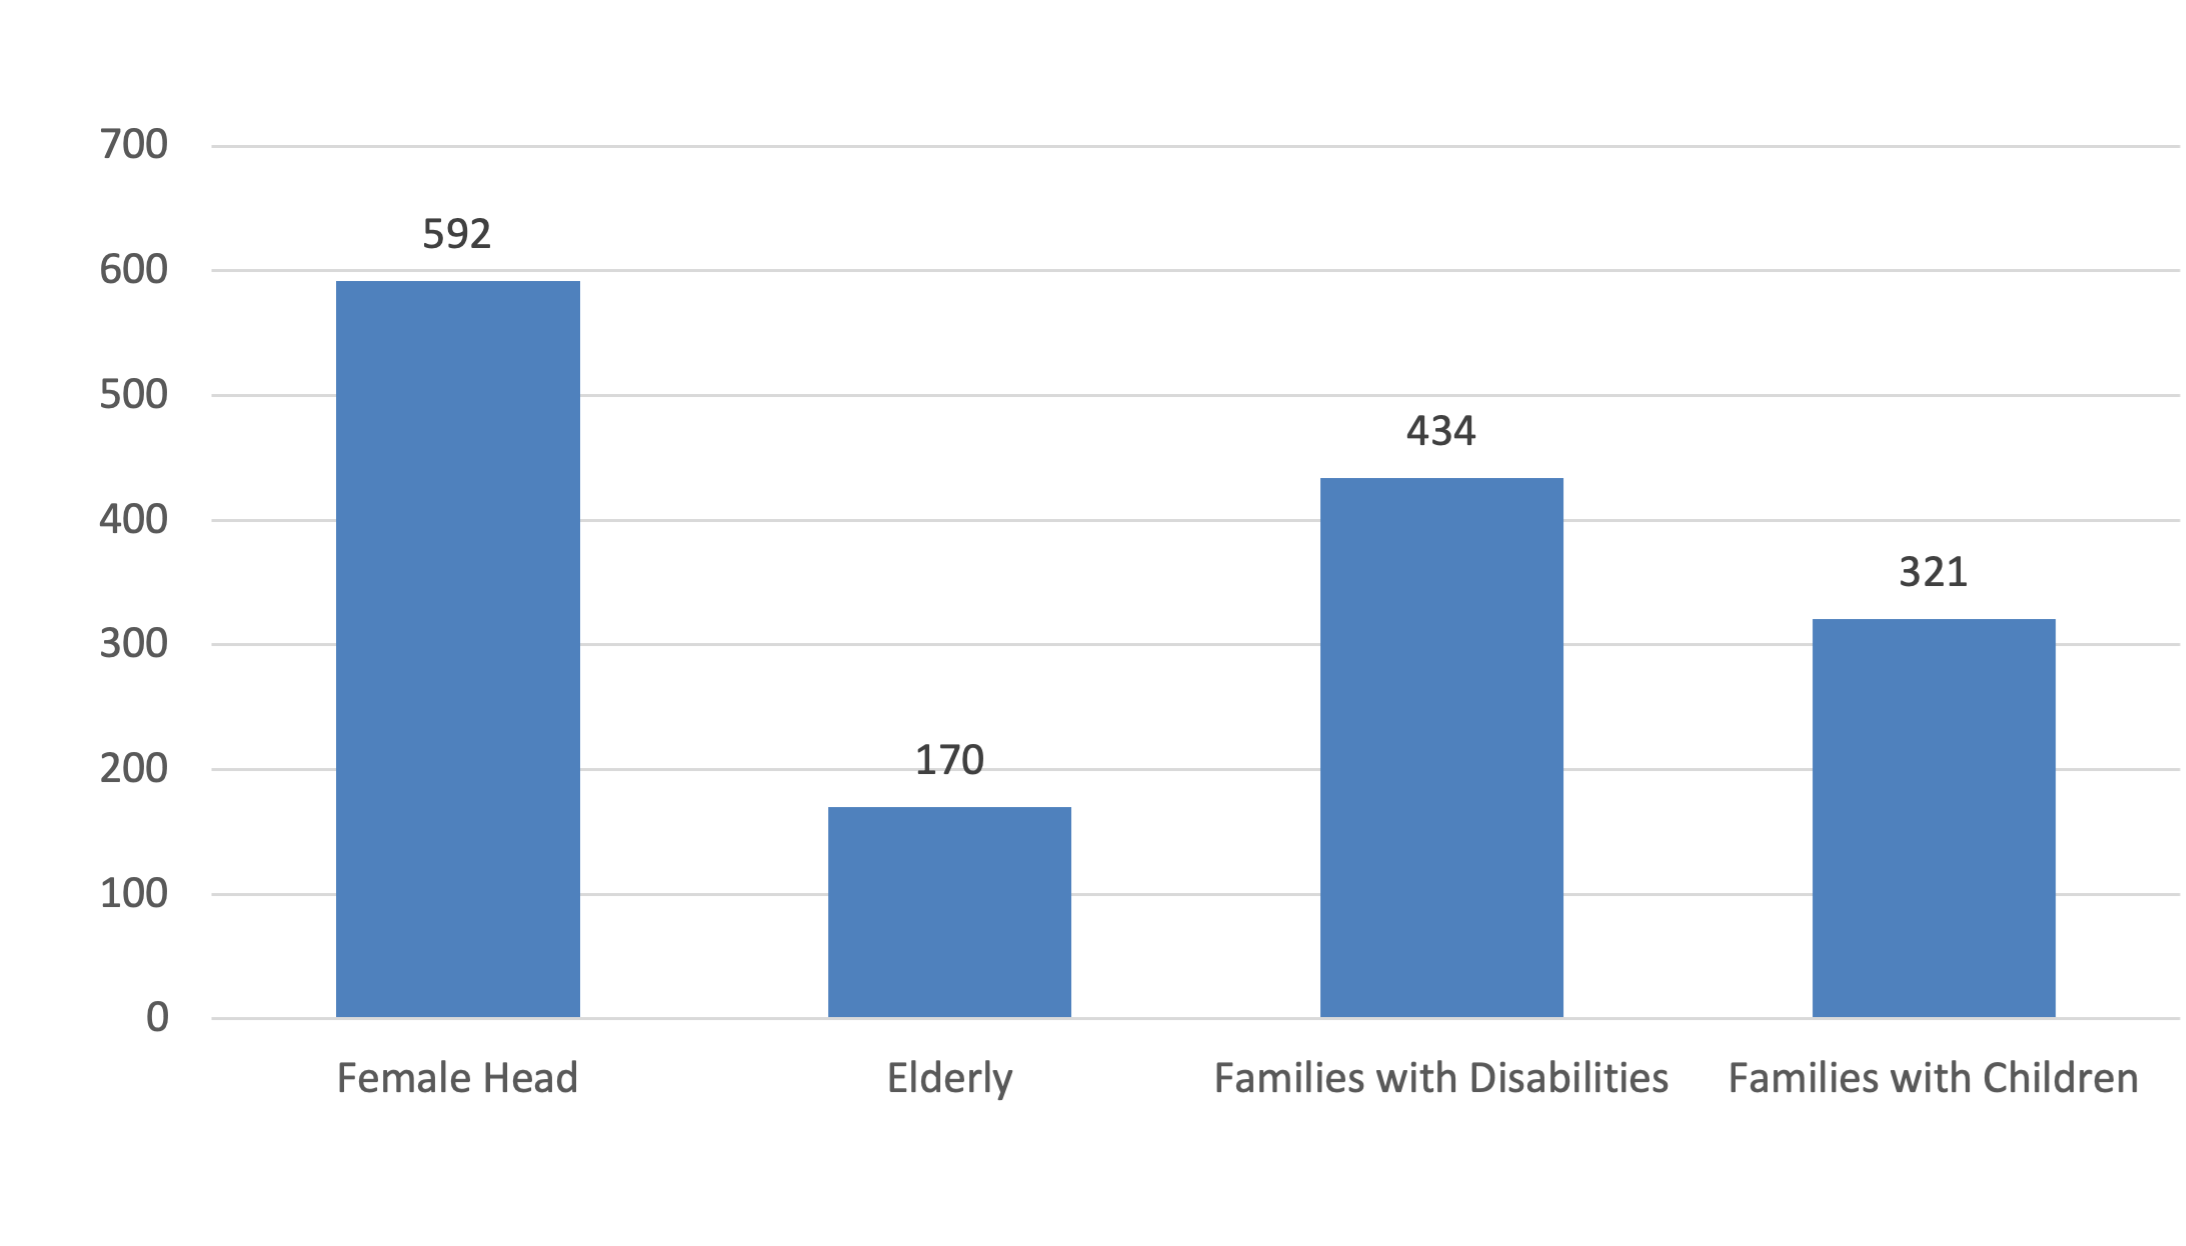
Waitlist Demographics
2019 Housing Costs
| Median value of owner-occupied housing units, 2015-2019 | $226,200 |
| Median selected monthly owner costs -with a mortgage, 2015-2019 | $1,473 |
| Median selected monthly owner costs -without a mortgage, 2015-2019 | $546 |
| Median gross rent, 2015-2019 | $966 |


